Monitoring Your DataNow Data: Now with Splunk!
*This post originally appeared on the AppSense blog prior to the rebrand in January 2017, when AppSense, LANDESK, Shavlik, Wavelink, and HEAT Software merged under the new name Ivanti.
I work with a lot of Enterprise customers using DataNow, and a good proportion of these have a Splunk deployment somewhere in their network. I’ve worked with a few customers in tweaking their Splunk setup to allow them to generate useful data from DataNow and wanted to share some insight into why I believe monitoring is a good idea, the monitoring options available, and some configuration tips for getting Splunk up and running with DataNow.
There are four main reasons you would want to monitor DataNow:
- As an on boarding tool: When rolling out DataNow to a large number of users, most deployments will result in syncing traffic to or from the server. For this reason, mass deployments are usually rolled out in manageable chunks to avoid saturating network links and infrastructure. The DataNow Windows client uploads statistics to the appliance at every logon and every 24 hour interval reporting the amount of data in its cache and the amount of data still left to sync. These statistics are output by the appliance in the configured syslog stream so it can be used to track the progress of rollouts and used to define the optimum point at which the next batch of users can be on boarded.
- As a security audit trail: This can be used to report on ‘who did what and when?’ for most features of DataNow, such as uploads, downloads, deletions, link based sharing etc.
- To report on utilization: To provide insight into DataNow usage patterns by operation and by device – this can assist with infrastructure capacity planning and trends over time
- As a support tool: Any server side failures such as bad passwords, users over quota, or other issues are output by syslog. Depending on the reporting platform used, these can be monitored proactively, and even have alerts created when a particular event is raised.
Because DataNow outputs its reporting information as standard syslog messages, it can be interpreted by any 3rd party syslog server. It’s worth calling out the DataNow integration feature of our Insight analytics product, which can parse the syslog output from DataNow appliances to provide useful and commonly used out-of-the-box drilldown dashboard charts and downloadable CSV to provide insight on:
- Users and devices
- Bandwidth Usage
- Bandwidth Trend
- File Activity
- Share Activity
If Splunk is chosen as the syslog destination, there’s a few configuration prerequisites to follow to get the best out of the data.
First up is the ‘slicing and dicing’ of the input stream using regex queries. This allows Splunk to identify ‘fields of interest’, and apply transformation to these so that Splunk knows which fields in the syslog message are related.
‘Under the hood’ these are referenced as props.conf and transforms.conf
The syslog listener is configured in inputs.conf
In a small deployment, a single Splunk instance may function as both the syslog receiver and the index.
Larger deployments may use clustered indexes and/or ‘Heavy Forwarders’ which increase scalability and resiliency to offload the collection and parsing of the input stream before being stored in the index. We recommend liaising with a Splunk resource for best practises with regards to the most appropriate deployment topology.
In terms of optimising the data stream, you may consider dropping ‘meta read’ messages which are logged during folder listings (background client operations) and account for a large majority of all syslog messages and not typically deemed as useful when reporting.
Once the data is in the index, you can begin searching and reporting straight away.
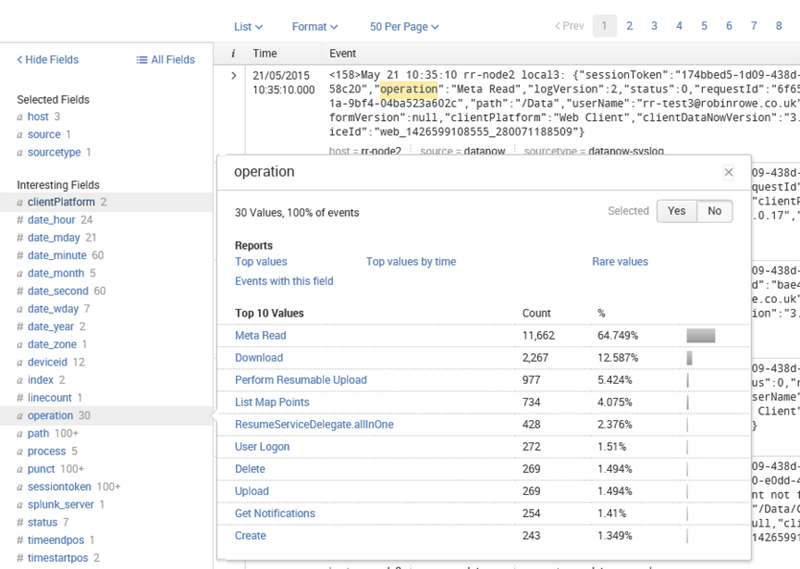
Once you enter a search term (in this case ‘operation’) a number of ‘interesting fields’ hyperlinks are populated on the left, which are context sensitive based on the events found for the selected time period.
These can be used as filters to build a query, or visualise the data results (e.g. top values by time).
Some of the most useful fields are:
- Operation (e.g. upload, download, delete)
- Path (e.g. /Mappoint/Folder/file)
- Username (e.g. username@domain)
Using just these fields, with just a few clicks you can find out which user interacted with a particular file within a specific time window and which of these operations was a ‘delete’.
It’s also possible to build powerful dashboards which can be displayed in a NOC (network operation center) to provide a holistic view of the DataNow estate to show trends over time:
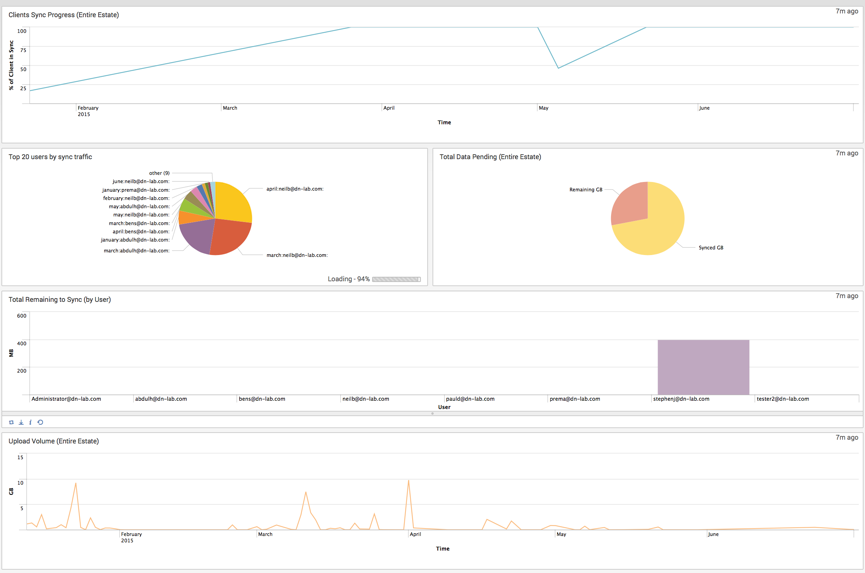
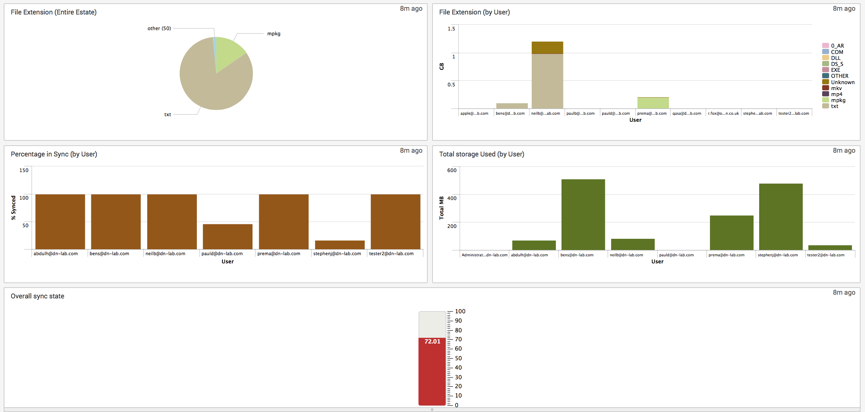
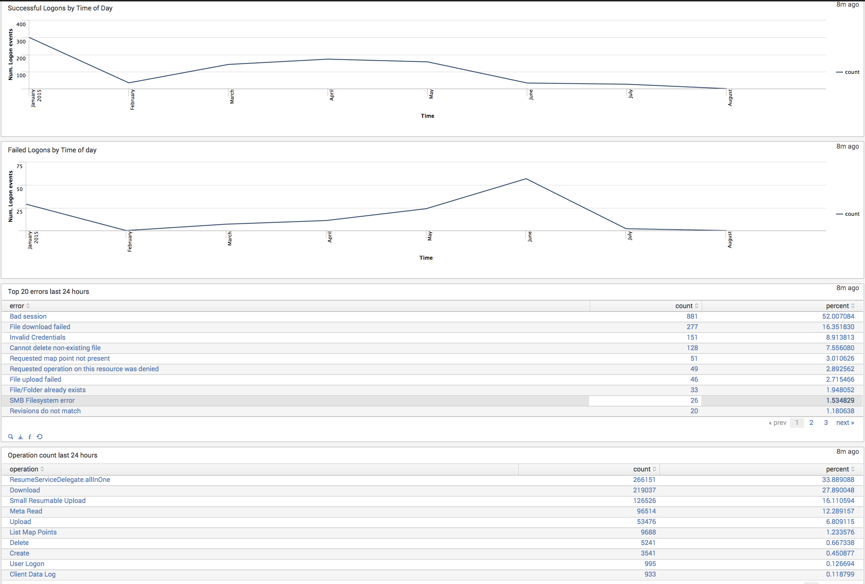
The dashboard above leverages a combination of pivot table / accelerated report driven data (the sync status and volume of data elements) and dynamic dependency-free searches which are executed at dashboard open / refresh.
This contains our recommended Props and Transforms settings, along with some sample reports and dashboard code to get you up and running.
I hope this is useful, any feedback is gratefully received.